seaborn color 팔레트
(예시) heatmap, pie, barh, countplot, distplot

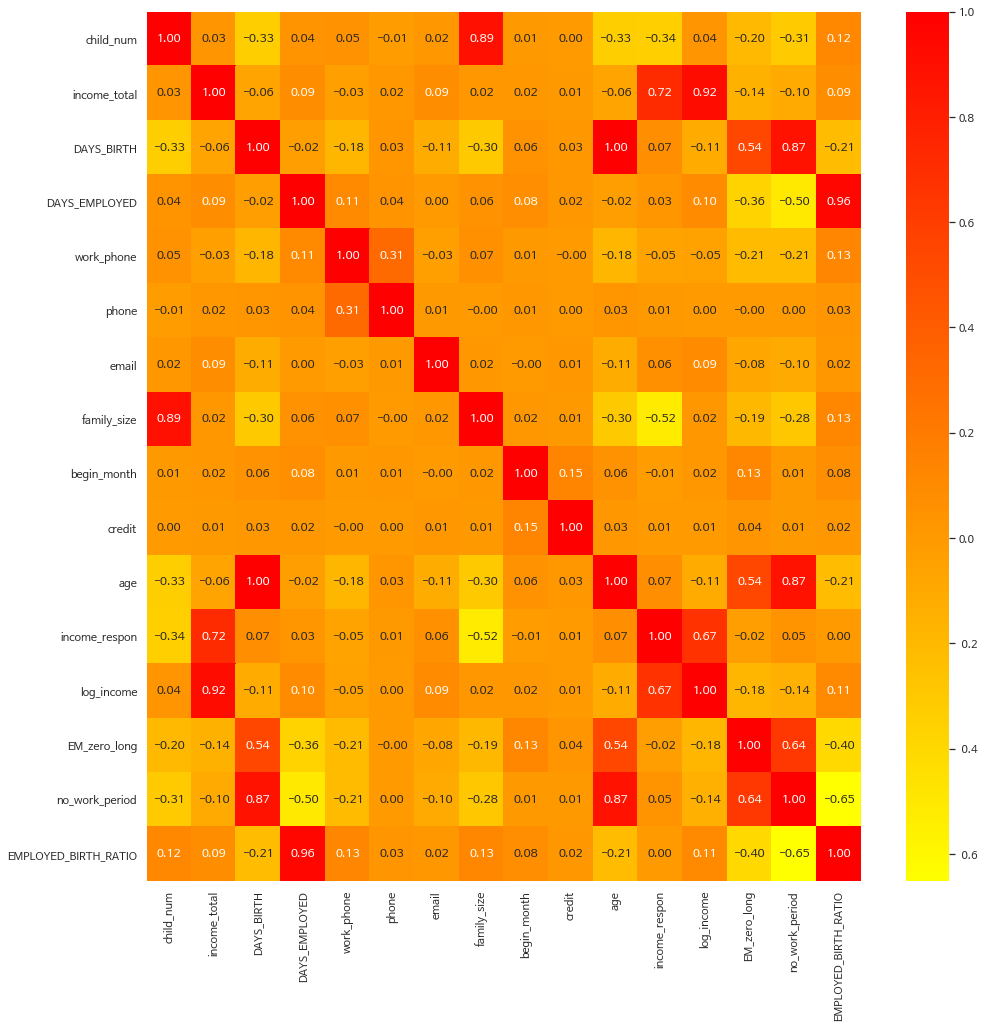
1. autumn_r - heatmap
import seaborn as sns
import matplotlib.pyplot as plt
%matplotlib inline

# data =
fig, ax = plt.subplots(figsize=(16,16))
ax = sns.heatmap(data.corr(),annot=True,fmt='.2f',cmap="autumn_r")

2. PRGn - heatmap

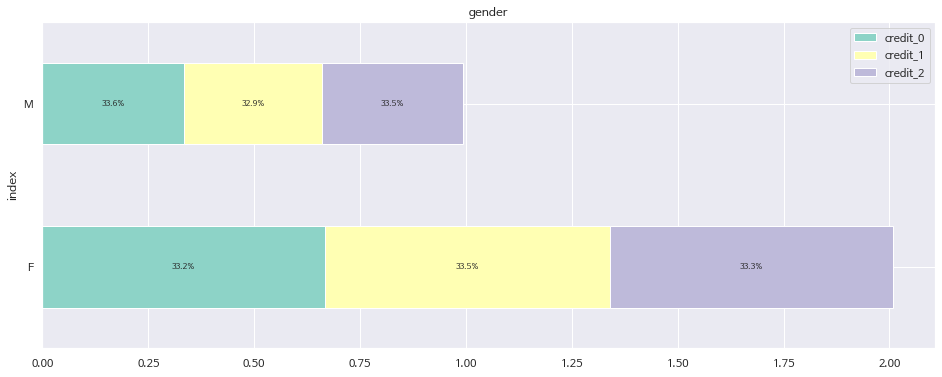
3. Set3 - pie, stacked barh
- 전체 sns plot 팔레트 설정
sns.set_palette("Set3")

plt.subplots(figsize = (8,8))
plt.pie(data.value_counts(), labels = data.value_counts().index,
        autopct="%.2f%%", startangle = 90)
plt.title('신용 등급 비율', size=20)
plt.show()

  credit_0 = data[data['credit']==0][feature].value_counts(normalize=True)
  credit_1 = data[data['credit']==1][feature].value_counts(normalize=True)
  credit_2 = data[data['credit']==2][feature].value_counts(normalize=True)

  df = pd.DataFrame([credit_0,credit_1,credit_2])
  df.index = ['credit_0','credit_1','credit_2']
  df = df.T
  df = df.reset_index()

  df.plot(x='index',kind='barh',stacked=True, title=feature, mark_right = True,figsize=(16, 6))

  df_total = df["credit_0"] + df["credit_1"] + df["credit_2"]
  df_rel = df[df.columns[1:]].div(df_total, 0) * 100

  for n in df_rel:
      for i, (cs, ab, pc) in enumerate(zip(df.iloc[:, 1:].cumsum(1)[n],
                                          df[n], df_rel[n])):
          plt.text(cs - ab / 2, i, str(np.round(pc, 1)) + '%',
                  va = 'center', ha = 'center', rotation = 0, fontsize = 8)
  f, ax = plt.subplots(1, 3, figsize=(16, 6))

  sns.countplot(x = feature,
                data = df,
                ax = ax[0],
                order = credit_0[feature].value_counts().index) # 큰 수부터 정렬


  ax[0].tick_params(labelsize=12)
  ax[0].set_title('credit_0')
  ax[0].set_ylabel('count')
  ax[0].tick_params(axis='x',rotation=50)

  for p in ax[0].patches:
    ax[0].annotate(f'\n{p.get_height()}', (p.get_x()+0.1, p.get_height()+70), color='black', size=12)
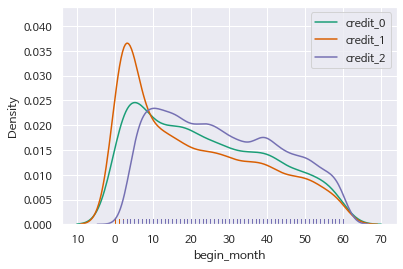
4. Dark2 - distplot
sns.set_palette("Dark2")

sns.distplot(credit_0[feature],label='credit_0', hist=False, rug=True)
sns.distplot(credit_1[feature],label='credit_1', hist=False, rug=True)
sns.distplot(credit_2[feature],label='credit_2', hist=False, rug=True)


plt.legend()
plt.show()
+ 참고 자료
http://hleecaster.com/python-seaborn-color/
'Visualization > BI - DW' 카테고리의 다른 글
| <3. 빅데이터의 분산처리> Hadoop, Spark 이용한 데이터 처리 (0) | 2023.05.21 |
|---|---|
| <2. 빅데이터의 탐색> 시각화(BI)하기 위한 데이터 마트 준비 (0) | 2023.04.23 |
| <1. 빅데이터의 기초 지식> BI란 무엇일까요? (3) | 2023.03.26 |
| [nbviewer] jupyter notebook 사이트 내 표시 (0) | 2021.07.21 |


댓글