- 검증지표 -> 수치
- 잔차진단 -> 시각화, 통계량
White Noise 백색잡음
- 2가지의 속성을 만족해야 하며 하나라도 만족하지 못하면 모델이 개선의 여지가 있음을 의미
- f(x) + e 에서 잔차인 e가 특정한 패턴을 보이지 않아야하며 잔차의 모습이 whitenoise 이어야 한다.
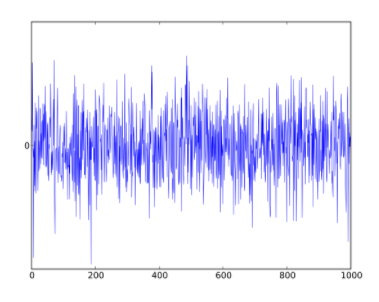
1) 잔차 ~ i.i.d

- 잔차들은 정규분포이고 평균 0과 일정한 분산을 가져야 함
- 잔차들끼리는 독립이어야 한다.
2) 잔차들간의 상관관계
- 잔차들이 시간의 흐름에 따라 상관성이 없어야 함
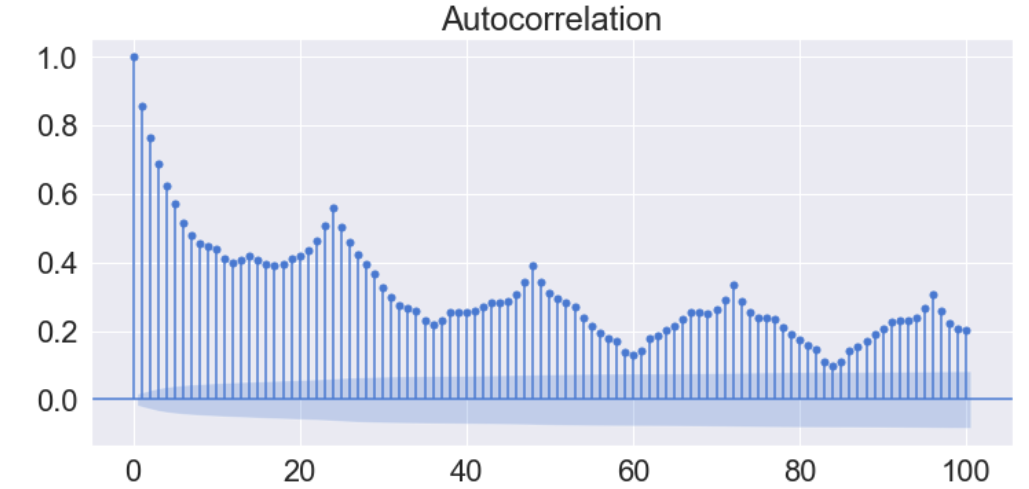
- Autocorrelation 자기상관함수 : 같은 변수, 자기 자신에 대한 상관관계
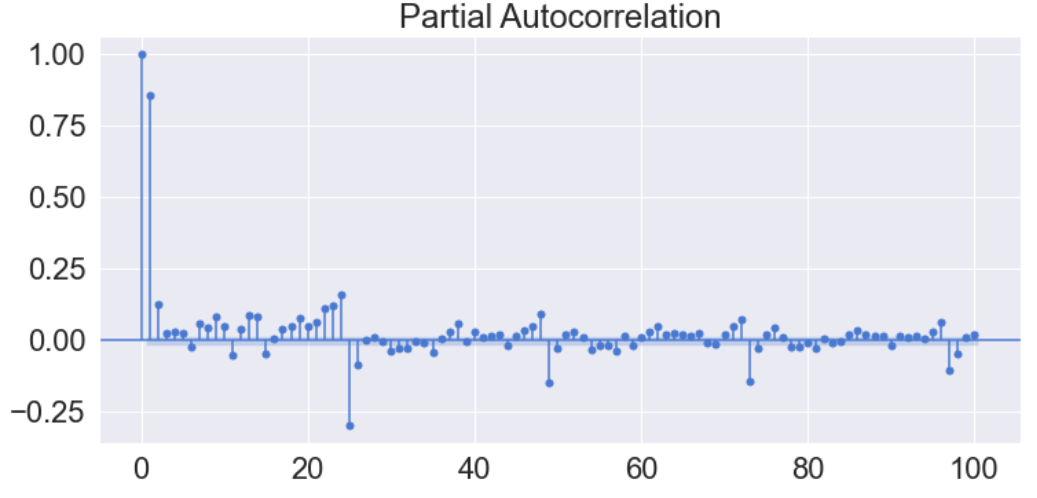
- Partial Autocorrelation Function 편자기상관함수 : 자기상관함수에서 시간 사이의 상관성을 제거한 상관함수

- SARIMA가 자기상관관계가 없다는 것을 보여줌
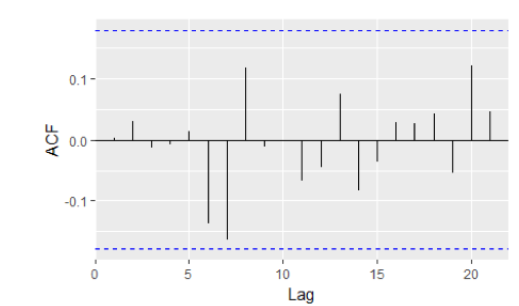
- 파란색을 넘지 않으면 자기상관이 없다고 본다
잔차진단 방향
- 정상성, 정규분포, 자기상관, 등분산성 확인
1) 정상성 테스트 - 데이터에서 추세나 계절성이 없는 것 / 평균, 분산, 공분산이 시간의 흐름에 따라 변하지 않음 / H1 : 정상 상태
- ( Augmented Dickey Fuller ) ADF test
- ADF-GLS test
- ( Phillips Perron ) PP test
- ( Kwiatkowski Phillips Schmidt Shin ) KPSS test : 다른 지표들과 가설 반대 - H1 : 비정상
2) 정규분포 테스트 - H1 : 정규분포가 아니다
- Shapiro-Wilk test
- Kolmogorov-Smirnov test
- Lilliefors test
- Anderson-Darling test
- Jarque-Bera test
- Pearson's chi-squared test
- D'Agostino's K-squared test
3) 자기상관 테스트 - H1 : 시간이 지나면 autocorrelation 은 0이 아니다. 자기상관관계가 있다.
- Ljung-Box test
- Portmanteau test
- Breusch-Godfrey test
- Durbin-Watson statistic : p-value가 아닌 검정통계량
- 2 근방으로 나오면 자기 상관관계 없다
- 0 or 4 근방에서는 자기 상관관계 있다.
( 0 : Positive Autocorrelation / 4 : Negative Autocorrelation )
4) 등분산성 테스트 - H1 : 시간이 지나면 등분산이 아니다. 발산하는 분산이다.
- Goldfeld-Quandt test
- Breusch-Pagan test
- Bartlett's test
잔차분석 시각화 코드
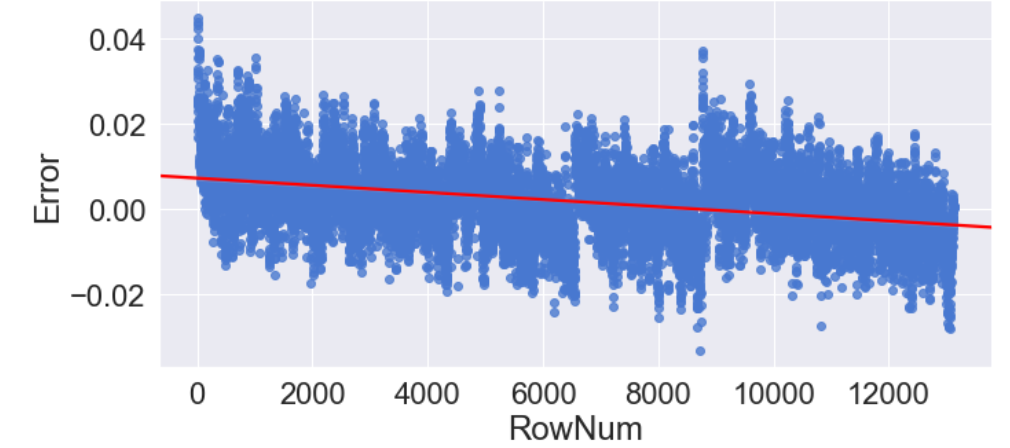
- 정상성 확인( - 이후 Lecture 10 )
sns.set(palette="muted", color_codes=True, font_scale=2)

sns.lmplot(data=Resid_tr_reg1.iloc[1:], x='RowNum', y='Error',
           fit_reg=True, line_kws={'color': 'red'})
- 정규분포 확인
sns.distplot(Resid_tr_reg1['Error'].iloc[1:], norm_hist='True', fit=stats.norm)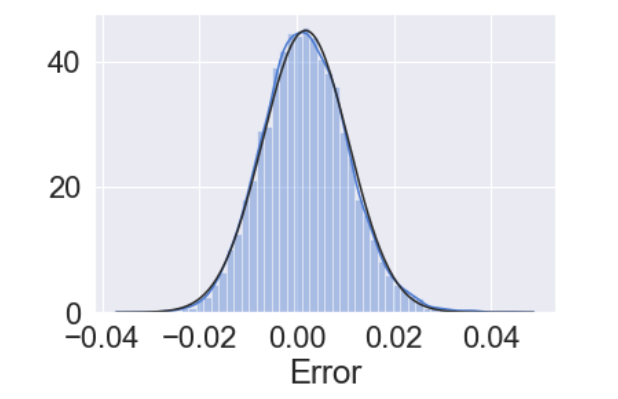
- 자기상관 확인
figure, axes = plt.subplots(1, 4, figsize=(30,5))
pd.plotting.lag_plot(Resid_tr_reg1['Error'].iloc[1:], lag=1, ax=axes[0])
pd.plotting.lag_plot(Resid_tr_reg1['Error'].iloc[1:], lag=5, ax=axes[1])
pd.plotting.lag_plot(Resid_tr_reg1['Error'].iloc[1:], lag=10, ax=axes[2])
pd.plotting.lag_plot(Resid_tr_reg1['Error'].iloc[1:], lag=50, ax=axes[3])

sm.graphics.tsa.plot_acf(Resid_tr_reg1['Error'].iloc[1:], lags=100, use_vlines=True)
잔차분석 통계량
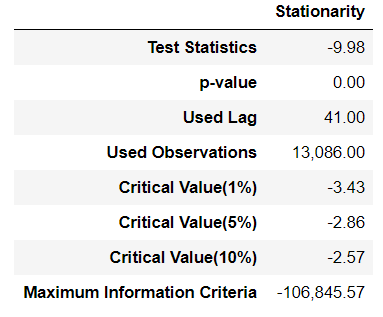
- 정상성 테스트 ( 예 : ADF test )
H0 : 비정상 상태 vs H1 : 정상 상태
Stationarity = pd.Series(sm.tsa.stattools.adfuller(Resid_tr_reg1['Error'])[0:4], index=['Test Statistics', 'p-value', 'Used Lag', 'Used Observations'])
for key, value in sm.tsa.stattools.adfuller(Resid_tr_reg1['Error'])[4].items():
    Stationarity['Critical Value(%s)'%key] = value
Stationarity['Maximum Information Criteria'] = sm.tsa.stattools.adfuller(Resid_tr_reg1['Error'])[5]
Stationarity = pd.DataFrame(Stationarity, columns=['Stationarity'])
- 정규분포 테스트 ( 예 : Shapiro-wilk test )
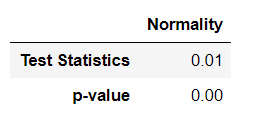
H0 : 정규분포이다 vs H1 : 정규분포가 아니다
Normality = pd.DataFrame([stats.shapiro(Resid_tr_reg1['Error'])], index=['Normality'], columns=['Test Statistics', 'p-value']).T
Normality
- 자기상관 테스트 ( 예 : Ljung-Box test )
H0 : 자기상관관계가 없다 vs H1 : 자기상관관계가 있다.
Autocorrelation = pd.concat([pd.DataFrame(sm.stats.diagnostic.acorr_ljungbox(Resid_tr_reg1['Error'], lags=[1,5,10,50])[0], columns=['Test Statistics']),
                             pd.DataFrame(sm.stats.diagnostic.acorr_ljungbox(Resid_tr_reg1['Error'], lags=[1,5,10,50])[1], columns=['p-value'])], axis=1).T
Autocorrelation.columns = ['Autocorr(lag1)', 'Autocorr(lag5)', 'Autocorr(lag10)', 'Autocorr(lag50)']
Autocorrelation

- 등분산성 테스트 ( 예 : Goldfeld-Quandt test )
H0 : 등분산이다 vs H1 : 등분산이 아니다. 발산하는 분산이다.
Heteroscedasticity = pd.DataFrame([sm.stats.diagnostic.het_goldfeldquandt(Resid_tr_reg1['Error'], X_train.values, alternative='two-sided')],
                                  index=['Heteroscedasticity'], columns=['Test Statistics', 'p-value', 'Alternative']).T
Error_Analysis = pd.concat([Stationarity, Normality, Autocorrelation, Heteroscedasticity], join='outer', axis=1)
Error_Analysis = Error_Analysis.loc[['Test Statistics', 'p-value', 'Alternative', 'Used Lag', 'Used Observations',
                                     'Critical Value(1%)', 'Critical Value(5%)', 'Critical Value(10%)',
                                     'Maximum Information Criteria'],:]
Error_Analysis

+ 참고 자료 및 출처
- 김경원 < 파이썬을 활용한 시계열 데이터 분석 A-Z 강의 > ( 패스트캠퍼스 강의 )
'Analysis > Time series' 카테고리의 다른 글
| Lecture 9. 시계열 머신러닝 알고리즘 (1) | 2021.03.27 |
|---|---|
| Lecture 8. 시계열 데이터 전처리 (0) | 2021.03.18 |
| Lecture 6. 분석성능 확인 (0) | 2021.03.16 |
| Lecture 5. 시계열 데이터 시각화 (0) | 2021.03.15 |
| Lecture 4. 시계열 데이터 분리 및 회귀분석 (0) | 2021.03.13 |


댓글